Radar Chart/Spider Web Chart-Powered by Aravind.
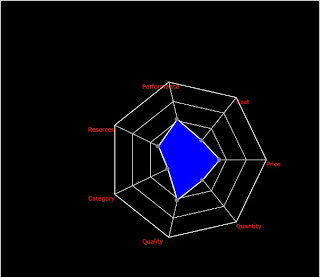
Radar Chart Version 1.0. A Radar chart is a graphical method of representing multivariate data in the form of a multi-dimensional chart of three or more quantitative variables represented on axes starting from the same point. The relative position and angle of the axes is typically uninformative. Radar chart is a part of next generation charts and also called as web chart, spider chart, and spider web chart. In a radar chart, a point close to the center on any axis indicates a low value. A point near the edge is a high value. In the football example, we would high marks near the outside due to the nature of what was being measured. In other scenarios, you might want points near the center, or low values. When you're interpreting a radar chart, check each axis as well as the overall shape to see how well it fits your goals. Radar chart developed in silverlight! Yes. I have developed radar chart using silverlight technology. Some of the basic concept behind the radar chart i...